Polar Mapping
A polar mapping is nice because the area growth law O(r^2),
corresponds exactly with the information content as a function of frequency.
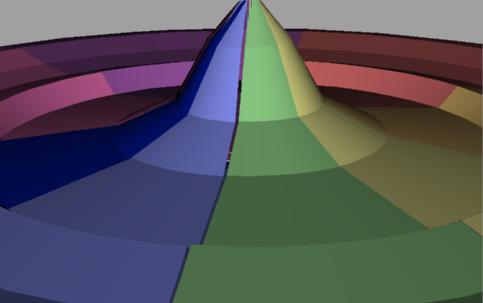
From the side this looks almost like an FFT, kinda:

So let's say the audience sees this for a while. Then suddenly the whole thing tilts down to reveal a spectacular New York Sized platter that looks like...
Imagine a cymbal whose vertical displacement is like a speaker cone for DC.
The inner ring of the cymbal represents the first "octave".
Each disk sector could represent a note, so that the spiral of notes winds
ever outward. The spatial resolution is low in regions where the frequency resolution
is low. Kind of looks like a UFO.
Nicholas did his science project on the physics of a fountain of salt sitting on a 17" subwoofer powered by a car battery and a 400 Watt Urban amplifier. Salt is very good for sound into graphics at low frequencies, and very bad at frequencies above say, 500 Hz.
There could be a concentric cymbal ring for every note, but that would over represent high frequencies. We would like the concentric areas to be sized according to sound power, since sound power goes as the log of 1/f.
- Van
...
Anyway, while looking at all of the flashing rectangles
that the birds-eye display shows I thought that it would
be cool to make a polar version of that display... what
should the mapping be? A spider chart? I think this
would be fun to explore. Could we have a Moto phone at
a MJ live concert sending the spider chart to the web?
...Pat
---