
The process of finding effective drugs
and clinical treatment schedules for minimizing angiogenesis is an arduous
process. At the minimum the process consists of:
1) treating eyes with a
candidate drug.
2) photographing retinas
in a disease or pre-disease state.
3) manually assessing pathological
regions on the retina using 12 slice "clock face" estimation.
4) comparing these results
with other laboratory trials.
This process, first explained to me by Dr. John Penn, Director of The Center for Eye Research at UAMS, is lengthy and labor intensive. Penn estimates that step 3 alone requires 25% of the resources for evaluating potential treatments. I proposed that computing the areal density of angiopathic regions was functionally identical to the cloud removal problem in remote sensing; A problem I had first encountered as technical director of the first satellite composite view of the earth, done with Tom Van Sant of the GeoSphere project in 1990. Without going into excessive detail, the cloud removal problem in remote sensing is the problem of filtering out unwanted haze, clouds and suspended water vapor that obscure ones view of the earth's surface.
In remote sensing the problem is that clouds and haze bear a context-dependent similarity to ice and other features that occur in the image. Consider a contrived example. A haze obscured forest might have the same color as a slightly vegetated tundra. One wants to keep the tundra color unchanged while modifying the saturation of the forest to reflect its actual value. There is no global image processing operator, no global convolution kernel, that can accomplish this task. This problem is exacerbated by the fact that NOAA AVHRR data consists solely of three channels of wide band infra-red "water sensitive" data, and a visible red, and finally a visible green channel. No blue data was available for disambiguating earth surface scenes - a circumstance that persists to this day with the AVHRR family of orbiting sensors.
It turned out that manual intervention - later nicknamed "The Human Umpire Principle" - was necessary during image processing. This principle was manually and laboriously applied on a scene by scene basis, region by region basis, a sever violation of our original hope. A hope to completely automate the process of reconstructing a no cloud earth under a deadline from the National Geographic Society. Although the project was completed, incredible manual effort spanning months of time and the labor of several technical and artistic staff members was required. Later, in August of 1997, I faced this problem again when doing a second earth image and was able to do a reconstruction without manual intervention due to a change in colorimetric representation. Rendering the earth and the eye possess interesting similarities besides the fact that both start with E, and both are nearly spherical...
Back to Dr. Penn's problem: Retinas are photographed at high spatial resolution - approximately 1K by 1K or 1 Megapixel, but in gray levels from 0 - representing black to 255 - representing white. Although excellent for revealing retinal detail, monochrome imaging turns out to be less than optimal for differentiating regions of retinal pathology. The consequence was that lighter tones of the generally darker diseased regions have the same gray level as darker tones of the generally darker normal regions. Consequently - as in the cloud problem - there was no way of distinguishing between the two on a global basis. I proposed the equivalent of "we need a blue channel", which resulted in the simple option of color photography of the retinas. With multi-channel retinal data, distinguishing - and accurately computing the neovascular density - is perhaps within closer reach.
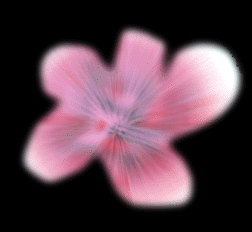
For the sake of this preliminary report, a simulated retinal image has been created. Although spatially the trial image possesses only a vague resemblance to a real retina, I propose that it is "close enough" colorimetrically for the purpose of process prototyping. This retina has been synthesized from a family of colors that correspond loosely to those that are found in real pathological retinas. For process design this is perfectly adequate. With that understood we will proceed.
Step One
Image one, below, shows that synthetic
retina:

Step Two
Image two, below shows the selection of
the actual active retina in the field. The shape here is arbitrary,
but the "orange peeling" is a significant factor in photographing actual
retinas and so must be included here.

Step Three
Image three, shows the result of an equalization
step applied to the previous image.
Step Four
Image four, shows a selection step that
will be used to identify those pixels in the active Field.

Step Five
Image five, illustrates another critical
step - the tagging of disease state regions.
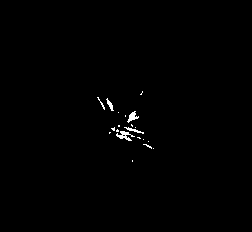
Step Six
Image six depicts the removal of
healthy region pixels from the scene.

Step Seven
Image seven shows the same image with
the border artifact manually removed. Again it is not known
at this writing whether the envelope will appear with a real retinal image.
One should assume it will.

Step Eight
Image eight shows the final resulting
image:
Conclusion
The process above prototypes one that
will hopefully be applied to real retinas in the near future. It
is hoped that this will not only improve the precision of quantifying angiogenesis,
but that this technique will lend itself to automated processing of large
sample sizes, enabling more potentially curative agents to be tested in
a shorter period of time. It is also hoped that this method can be
made real time by linking directly to multispectral
digital CCD cameras connected to real time image processing platforms.
This would enable "walk-in" and non-invasive methods of disease assessment
and clinical evaluation. The PDQ-A method developed in this document
is colorimetric in nature. A second complementary method B, called
PDQ-B is stereographic in nature, exploiting the surface characteristics
of neovascularization using stereographic imaging of retinas. Quoting
Rocío Salceda of the National University of México,
"The vertebrate retina consists of two components: the
retinal pigment epithelium (RPE) and the neural retina itself. The RPE
that originates from the optic cup, is a monolayer of cells located between
the photoreceptors of the neural retina and the choroidal capillaries.
The neural retina consists of six distinct neural cell types organized
in a perfectly layered structure." Neovascular regions occur
above the extremal retinal surface making three dimensional detection
via elevation thresholding a possibility. If successful
PDQ-A will be more precise in assessing the results of clinical trials
than methods currently in use.
Acknowledgments
Without the following people this work would not exist. Kerrey
Roberto helped me to understand the laboratory procedures that gave rise
to the retinal images. Bethany Warren provides a daily fresh look
at eyes. Lynn Warren prompted our first book on strabismus and reviewed
this draft. John Peterson of Adobe for providing the excellent software
used in this article. Netscape provided the browser used to lay this
paper up and publish it instantly. Pat Kane of Champaign, IL provided
enough RAM to process large images. Tsutomo Ohshima of Caltech put
seriousness in my eyes. Tom Van Sant of the Geosphere project made
a movie that started in space and ended in the eye of his son suggesting
the connection between remote sensing and retinal imaging. Leo Blume
assisted in the software implementation that led to the creation of the
4km GeoSphere image. Dave Warren, DA Hammond, Russ Sandberg and the
late great Joseph Stone of the Little Rock Medical Center got me going.
God made the earth and the eyes therein, the crown jewels of creation.
References & Related Links (examined 9/5/97)
(c) 1997 L. Van Warren/Warren
Design Vision * All Rights Reserved